
Market Snapshot for Tampa Retail Real Estate
We’ve compiled a range of the latest statistics (vacancy rates, absorption rates, and rental rates) and property transactions for Tampa retail real estate in this report. The Tampa retail report is updated quarterly by our commercial real estate professionals. However, in order to give a broader spectrum of what is going on here, it is important to provide some context for one of the main drivers of investments in retail and commercial real estate in general, population growth.
It is well known that Florida is one of the top states for population growth in the United States. This is due to several key factors: 1) it’s tax-friendly, 2) many people from other states come to Florida to retire, and 3) it’s famous for having wonderful weather year-round, hence its nickname: The Sunshine State. According to World Population Review, Florida is ranked 7th in the country for population growth during 2021 with an increase of +1.1%
Furthermore, according to the US News and World Report, Florida has 11 of the 25 Fastest-Growing Places in the United States with Tampa ranked 15th. Population growth is not the only important factor to consider when looking at the potential of a retail real estate market (or commercial real estate overall); however, it is definitely a solid indicator of where money is going in general.
View our commercial properties in Florida to see what real estate assets are available for lease / sale.
Before we dive into the specific statistics for Tampa’s retail real estate market in Q4 2024, let’s give some perspective with the overall capital markets figures to give some context to the region’s retail sector.
Tampa Retail Capital Markets Statistics Q4 2024
Total Asset Value: $47.7B
12-Month Sales Volume: $1.3B
Average Market Cap Rate: 6.5%
12-Month Market Sale Price Change / SF: +4.0%
Tampa Retail Real Estate Sales Volume by Buyer Type & Origin (Past 12 Months)
Below are the buyer types and their origins, i.e.: local, national, or international investors of retail properties in Tampa.
Buyer Type:
Private: 62%
User: 11%
Institutional: 12%
Private Equity: 4%
REIT / Public: 11%
Buyer Origin:
Local: 18%
National: 79%
Foreign: 3%
Tampa Retail Real Estate Asset Value by Owner Type & Origin (Past 12 Months)
Below are the owner types and the origins of retail property owners in Tampa broken down by their percentage of representation.
Owner Type:
Private: 54%
User: 23%
REIT / Public: 7%
Institutional: 15%
Private Equity: 1%
Owner Origin:
Local: 36%
National: 61%
Foreign: 3%
Tampa Retail Real Estate Statistics: Leases, Sales, and Projects Under Construction – Q1 2024
Here’s a summary of the statistical highlights, latest retail transactions, vacancy / lease trends, and current market activity for Central Florida focusing on Tampa. The analysis below is derived and compiled from leasing stats, latest transactions, and projects under construction in order to further understand the overall state of the retail real estate market in Tampa.
Full List of Top Transactions for Q1 2024 Provided Below
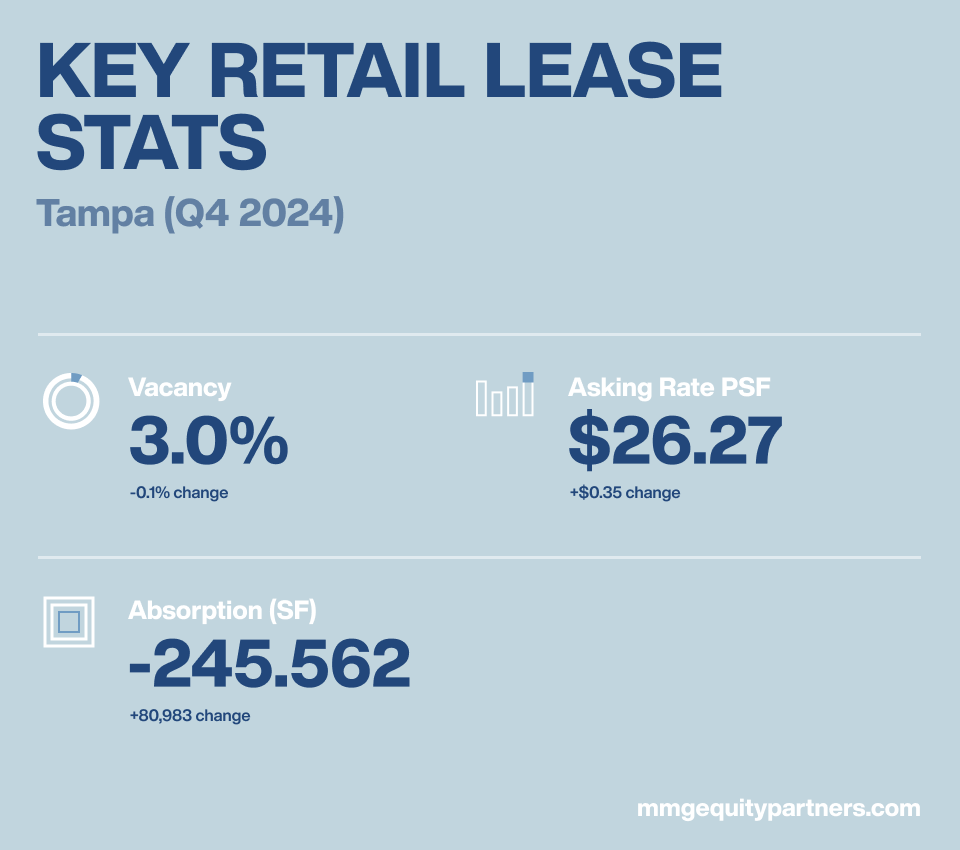
KEY RETAIL LEASE STATS: Tampa (Q1 2024)
- Vacancy: 3.0%
- Absorption: 245,562
- Asking rate PSF: $26.27
TOP RETAIL LEASING STATISTICS: Tampa (Past 12 Months)
12 Month Deliveries in SF: 1.2M
12 Month Net Absorption in SF: 813K
Vacancy Rate: 3.2%
12 Month Rental Growth: 3.6%
Q2 2024 TOP LEASING TRANSACTIONS: Tampa (Past 12 Months)
1. City Furniture – Pasco County
Tenant: City Furniture
Size: 144,372 SF
Space Type: Shopping Center
Tenant Rep Co: Not Listed
Leasing Rep Co: Colliers
2. 2317 Gunn Hwy – Pasco County
Tenant: Lowe’s
Size: 138,339 SF
Space Type: Shopping Center
Tenant Rep Co: Not Listed
Leasing Rep Co: Atlantic Capital Partners
3. Coastal Way – Hernando County
Tenant: BJ’s Wholesale Club
Size: 103,500 SF
Space Type: Shopping Center
Tenant Rep Co: LQ Commercial Realty
Leasing Rep Co: Brixmor Property Group
4. The Factory St. Pete – South Pinellas
Tenant: St Pete Athletic Paddle…
Size: 51,000 SF
Space Type: Shopping Center
Tenant Rep Co: Axxos / KW Commercial
Leasing Rep Co: Axxos
5. Cortez Blvd – Hernando County
Tenant: EoS Fitness
Size: 40,000 SF
Space Type: Shopping Center
Tenant Rep Co: SRS Real Estate Partners
Leasing Rep Co: Colliers
TOP RETAIL SALES STATISTICS: Tampa (Past 12 Months)
Over the course of the past 12 months there have been 639 total retail real estate transactions in Tampa with an average cap rate of 6.3%. The average price per square foot at the time of sale was $291, and the average vacancy was 1.2%.
Sales Comparables: 639
Average Cap Rate: 6.5%
Average Price/ SF: $217
Average Vacancy at Sale: 1.4%
TOP RETAIL SALES TRANSACTIONS: Tampa (Q4 2024)
Top Transaction Highlight in Q4 2024: Britton Plaza
1. Nature Coast Commons (1253-1437 Wendy Ct)
Price: $40,000,000
Size: 225,806 SF
Price/ SF: $177
Cap Rate: Not Listed
Vacancy: 0.8%
2. 1508 W Brandon Blvd
Price: $37,200,000
Size: 64,773 SF
Price/ SF: $574
Cap Rate: Not Listed
Vacancy: 0%
3.Bass Pro Shops
Price: $33,442,900
Size: 132,734 SF
Price/ SF: $252
Cap Rate: Not Listed
Vacancy: 0%
4. The Walk at Highwoods… (18001-18045 Highwoods..)
Price: $24,007,569
Size: 111,000 SF
Price/ SF: $216
Cap Rate: Not Listed
Vacancy: 0%
5. 2495 Gulf To Bay Blvd
Price: $23,000,000
Size: 114,225 SF
Price/ SF: $201
Cap Rate: 5.2%
Vacancy: 0%
RETAIL CONSTRUCTION PROJECTS STATISTICS: Tampa (Past 12 Months)
There are currently 24 retail assets / properties under construction in the Tampa market representing a little over 250K square feet of new product. This represents 0.1% of the total retail real estate inventory and over 60% of the total space is pre-leased.
Below the stats you’ll find the top-5 largest retail projects currently under development.
Properties Currently Under Construction: 24
Total Size: 260,930
Percent of Inventory: 0.1%
Pre-leased: 62.7%
RETAIL CONSTRUCTION PROJECTS: Tampa (Past 12 Months)
1. 16232 Redstone Wy
Size: 57,344 SF
Completion Date: Q1 2025
Developer/ Owner: Not Listed
Stories: 1
2. 26946 Halter Loop
Size: 40,000 SF
Completion Date: Q1 2025
Developer/ Owner: Not Listed / Bissett McGrath Properties
Stories: 1
3. Upper Alafia Ct
Size: 30,000 SF
Completion Date: Q3 2025
Developer/ Owner: Not Listed
Stories: 2
4. Bldg D (205 N Rome Ave)
Size: 15,898 SF
Completion Date: Q3 2025
Developer/ Owner: Not Listed / Asana Partners
Stories: 1
5. 4000 Post Oak Blvd
Size: 15,000 SF
Completion Date: Q2 2025
Developer/ Owner: Not Listed / Capital Design Development
Stories: 1
Data sources: MMG Equity Partners & CoStar
Florida Retail Real Estate Reports
We also provide retail real estate reports for other regions of Florida.
Miami Retail Real Estate Report
Orlando Retail Real Estate Report
Leave a Reply