Market Snapshot for South Florida Retail Real Estate
Here’s our quarterly summary South Florida commercial real estate focusing on Miami retail real estate. The report includes statistical highlights (cap rates, vacancy rates, absorption, etc), the latest retail transactions, signed leases, retail trends, and current market activity. The retail real estate report is updated by our CRE experts who focus on the retail real estate sector. The analysis is derived and compiled from leasing data, transaction reports, and under construction projects in order to better understand the overall health of the Miami retail real estate market.
View our commercial properties in Florida to see what real estate assets are available for lease / sale.
Before we dive into the specific statistics for Miami’s retail market in Q4 2023, let’s take a look at the overall capital markets figures to give some context to the region’s retail real estate sector.
Miami Retail Capital Markets Statistics
Total Asset Value: $66.1B
12-Month Sales Volume: $1.2B
Average Market Cap Rate: 5.4%
12-Month Market Sale Price Change / SF: +3.5%
Miami Retail Real Estate Sales Volume by Buyer Type & Origin (Past 12 Months)
Below are the buyer types and their origins, i.e.: local, national, or international investors of retail properties in Miami.
Buyer Type:
Private: 64%
User: 27%
Institutional: 2%
Private Equity: 5%
REIT / Public: 2%
Buyer Origin:
Local: 36%
National: 62%
Foreign: 2%
Miami Retail Real Estate Asset Value by Owner Type & Origin (Past 12 Months)
Below are the owner types and the origins of retail property owners in Miami broken down by their percentage of representation.
Owner Type:
Private: 63%
User: 16%
REIT / Public: 11%
Institutional: 8%
Private Equity: 2%
Owner Origin:
Local: 56%
National: 39%
Foreign: 5%
Miami Retail Real Estate Statistics: Leases, Sales, and Projects Under Construction – Q4 2023
In Q4 2023 the Miami retail market’s vacancy rate dropped -0.3% in contrast to Q3 2023 at 3.0%. The asking rate per sq. foot moved up slightly to an average of $44.66, which is +$0.28 per sq. foot compared to Q3 2023’s average asking rate of $44.38 / sq. foot. Meanwhile, the absorption rate went up to 229,848 in Q4 2023 from 36,521 in Q3 2023, which represents a +193,3274 SF change quarter-to-quarter.
Insights on the current retail market in South Florida:
The Miami market is firing on all cylinders with an abundance of capital seeking limited inventory that is driving property prices and rents higher. Rent growth has been significant, and transactions that are currently under contract or have recently traded are setting record numbers, in all asset classes.”
– Marcos Puente, Director of Acquisitions, MMG Equity Partners
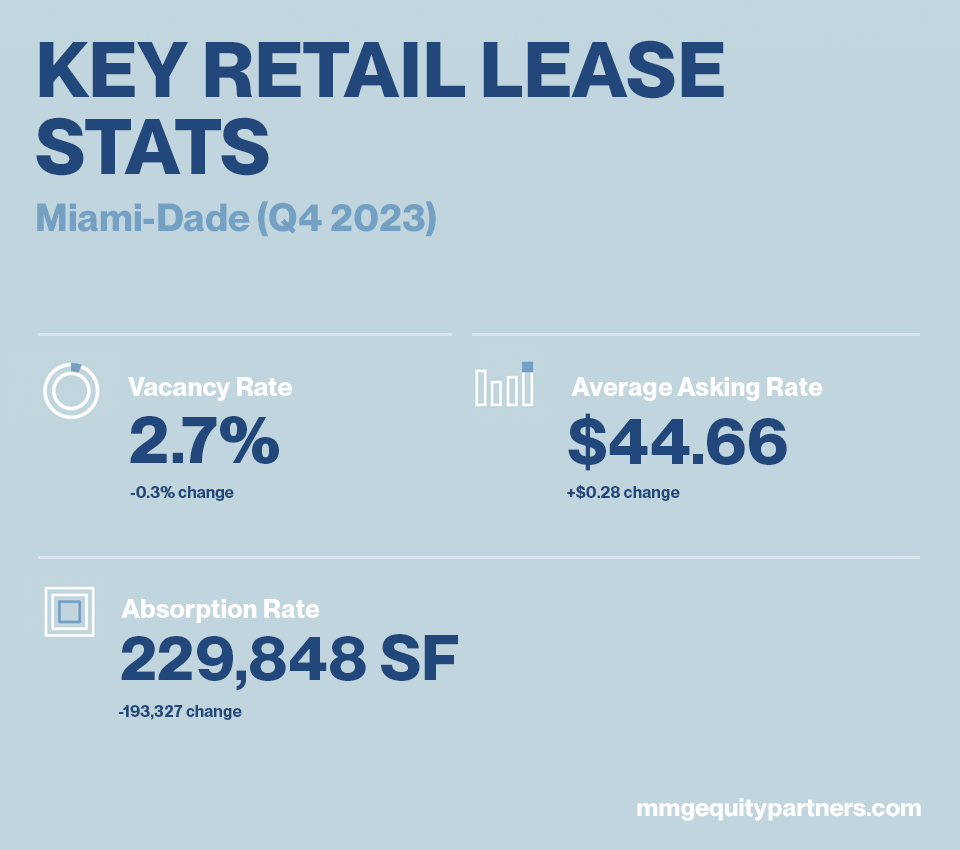
KEY RETAIL LEASE STATS: Miami-Dade (Q4 2023)
Vacancy: 2.7% (-0.3% compared to 3.0% in Q3 2023)
Absorption: 229,848 (Compared to 36,521 in Q3 2023, -193,327 change)
Asking rate PSF: $44.66 (Compared to $44.38 in Q3 2023, +$0.28 change)
TOP RETAIL LEASING STATISTICS: South Florida (Past 12 Months)
12 Month Deliveries in SF: 1.4M (2M in Q3 2023)
12 Month Net Absorption in SF: 1.6M (1.8M in Q3 2023)
Vancancy Rate: 2.7% (3.0% in Q3 2023)
12 Month Rental Growth: 6.0% (4.4% in Q3 2023)
Vacancy rates in the South Florida commercial real estate market have stayed around 3-4% consistently for over half of a decade now, even with rental rates once again reaching historic highs and recovering once again after the initial impact of the pandemic. Obviously Covid-19 had a widespread effect on many markets, including South Florida retail; however, Miami continues to lead rental rates in the area at $44.66 / sf with a vacancy rate of 2.7%, as opposed to Palm Beach County at $34.91 / sf with a vacancy rate of 3.7% or Fort Lauderdale with a leasing price of $35.02 / sf and 3.7% average vacancy rate.
Q4 2023 TOP LEASING TRANSACTIONS: South Florida (Past 12 Months)
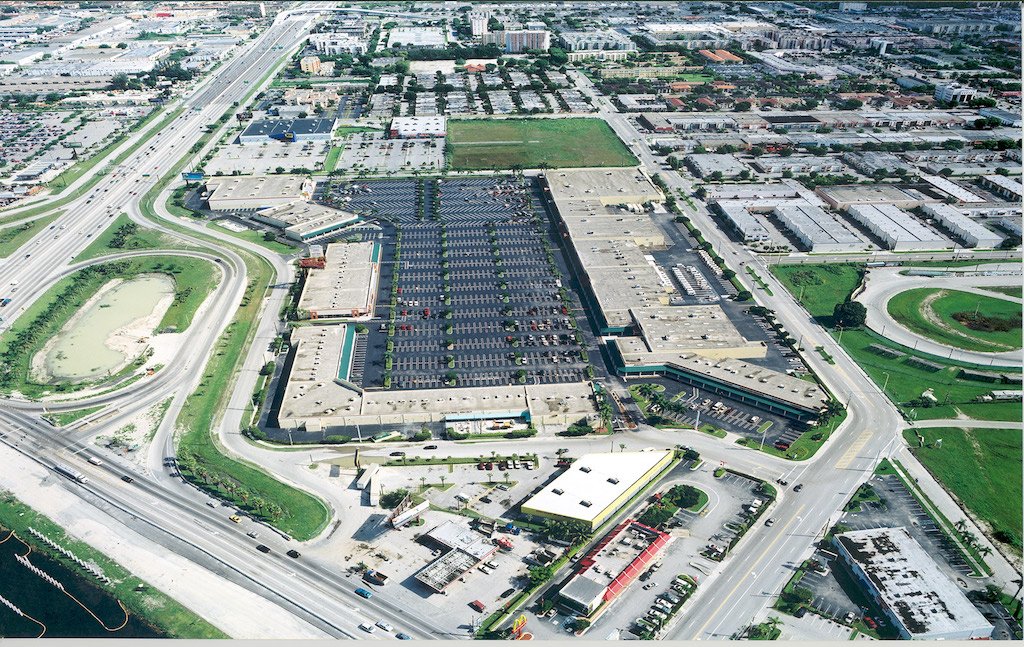
1. Dadeland Mall – Kendall
Tenant: Dick’s Sporting Goods
Size: 149,500 SF
Space Type: Shopping Center
Tenant Rep Co: Not Listed
Leasing Rep Co: JLL
2. 12350 SW 8th St – Kendall
Tenant: Flying Squirrel Sports
Size: 120,000 SF
Space Type: Shopping Center
Tenant Rep Co: Not Listed
Leasing Rep Co: Gadinsky Real Estate
3. 1501 Biscayne Blvd – Biscayne Corridor
Tenant: Key Point Christian Academy
Size: 62,349 SF
Space Type: Shopping Center
Tenant Rep Co: Colliers
Leasing Rep Co: Colliers
4. Block 55 at Sawyer’s Walk – Downtown Miami
Tenant: Target
Size: 50,000 SF
Space Type: Retail Property
Tenant Rep Co: Not Listed
Leasing Rep Co: Not Listed
5. The Shoppes at Highland – Miami Lakes
Tenant: Publix
Size: 48,387 SF
Space Type: Shopping Center
Tenant Rep Co: Not Listed
Leasing Rep Co: Not Listed
See Top Retail Leases in South Florida Q4 2023
TOP RETAIL SALES STATISTICS: Miami (Past 12 Months)
Over the course of the past 12 months there have been 375 total retail real estate transactions in Miami / South Florida with an average cap rate of 5.5%. The average price per square foot at the time of sale was $342, and the average vacancy was 5.3%.
Sales Comparables: 375 (423 in Q3 2023)
Average Cap Rate: 5.5% (5.4% in Q3 2023)
Average Price/ SF: $342 ($412 in Q3 2023)
Average Vacancy at Sale: 5.3% (3.8% in Q3 2023)
TOP RETAIL SALES TRANSACTIONS: Miami-Dade (Q4 2023)
Top Transaction Highlight in Q3 2022: 300 Almeria Ave ($55M for 143,716 SF)
1. 300 Almeria Ave
Price: $55,000,000
Size: 143,716 SF
Price/ SF: $383
Cap Rate: Not Listed
Vacancy: 0%
2. 10701 SW 211th St
Price: $45,000,000
Size: 155,837 SF
Price/ SF: $289
Cap Rate: Not Listed
Vacancy: 0%
3. 2801 Salzedo St
Price: $45,000,000
Size: 190,678 SF
Price/ SF: $236
Cap Rate: Not Listed
Vacancy: 0%
4. Greenery Mall (7702 – 7770 N Kendall Dr)
Price: $38,797,761
Size: 135,290 SF
Price/ SF: $287
Cap Rate: Not Listed
Vacancy: 9.6%
5. Trail Plaza (900 – 1190 SW 67th Ave)
Price: $36,816,399
Size: 168,000 SF
Price/ SF: $219
Cap Rate: Not Listed
Vacancy: 0%
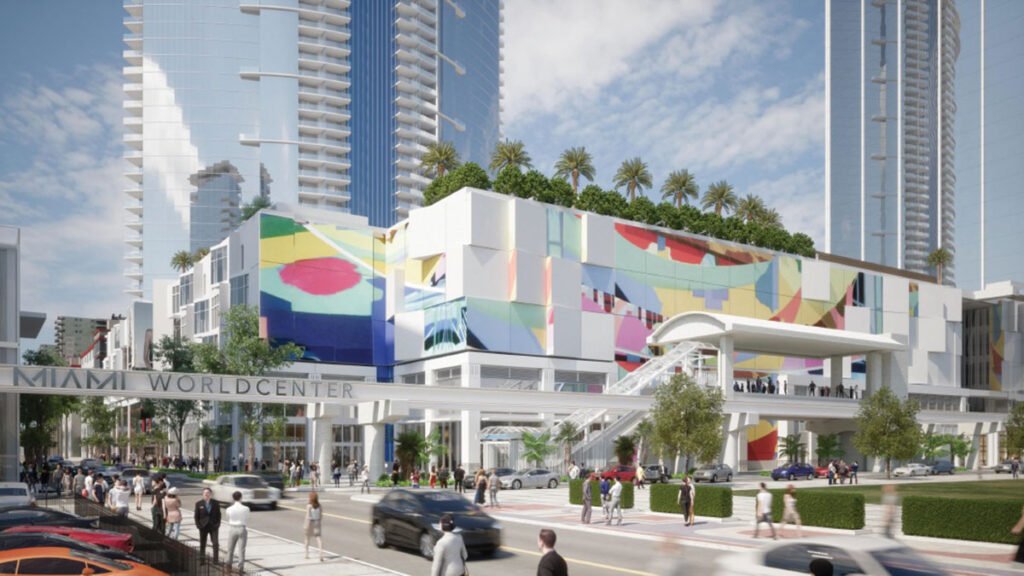
Rendering of one of the largest retail real estate construction projects in Miami over the last few years, Miami WorldCenter
RETAIL CONSTRUCTION PROJECTS STATISTICS: South Florida (Past 12 Months)
There are currently 31 retail properties under construction in the Miami market representing a little over 1.2M square feet of new product. This represents 0.8% of the total retail real estate inventory and just over 90% of the total space is pre-leased.
Below the stats you’ll find the top-5 largest retail projects currently under development.
Properties Currently Under Construction: 31 (31 in Q3 2023)
Total Size: 1,218,564 (2,044,803 SF in Q3 2023)
Percent of Inventory: 0.8% (1.4% in Q3 2023)
Pre-leased: 94.3% (94.1% in Q3 2023)
RETAIL CONSTRUCTION PROJECTS: South Florida (Past 12 Months)
3. Miami WorldCenter – Retail
Size: 300,000 SF
Completion Date: Q3 2024
Developer/ Owner: Miami WorldCenter Associates, LLC / Lalezarian Propertis
Stories: 3
2. 9700 Collins Ave
Size: 250,000 SF
Completion Date: Q4 2024
Developer/ Owner: Bal Harbour Shops / Whitman Family Development
Stories: 2
3. Block 55 at Sawyer’s Walk
Size: 175,000 SF
Completion Date: Q3 2024
Developer/ Owner: Not Listed / Not Listed
Stories: 1
4. SoLe Mia Village
Size: 96,860 SF
Completion Date: Q2 2024
Developer/ Owner: Turnberry Associates
Stories: 1
5. 1769 Purdy Ave
Size: 55,660 SF
Completion Date: Q2 2024
Developer/ Owner: Not Listed / Koniver Stern Group
Stories: 5
Data sources: MMG Equity Partners & CoStar