Market Snapshot for Miami Multifamily Real Estate
We’ve compiled key statistics (vacancy rates, absorption rates, and rental rates) and property transactions for Miami multifamily real estate in this report. The Miami multifamily report is updated quarterly by our commercial real estate professionals. We also want to cover the bigger picture and provide some information about the health of the economy overall in Miami / South Florida, as that is the engine that drives the business taking place in the region.
Florida is one of the top states for population growth in the United States, and recently has experienced a population boom. Some estimate that nearly 1,000 people move to the state every day! There are a few important factors that contribute to this: 1) it’s very tax-friendly (no income tax), 2) many people from other states (New York, for example) move to Florida to retire, and 3) it has a great reputation for having desirable weather year-round. This may be the reason for its nickname, The Sunshine State.
View our commercial properties in Florida to see what real estate assets are available for lease / sale.
Before we dive into the specific statistics for Miami’s multifamily real estate market in Q2 2024, let’s give some perspective with the overall capital markets figures to give some context to the region’s multifamily sector.
Miami Multifamily Capital Markets Statistics Q2 2024
Total Asset Value: $65.7B
12-Month Sales Volume: $1.1B
Average Market Cap Rate: 5.3%
12-Month Market Sale Price Change / SF: 0.2%
Miami Multifamily Real Estate Sales Volume by Buyer Type & Origin (Past 12 Months)
Below are the buyer types and their origins, i.e.: local, national, or international investors of multifamily assets in Miami.
Buyer Type:
Private: 63%
User: 2%
Institutional: 34%
Private Equity: 1%
REIT / Public: 0%
Buyer Origin:
Local: 25%
National: 74%
Foreign: 1%
Miami Multifamily Real Estate Asset Value by Owner Type & Origin (Past 12 Months)
Below are the owner types and the origins of multifamily property owners in Miami broken down by their percentage of representation.
Owner Type:
Private: 71%
User: 11%
REIT / Public: 3%
Institutional: 11%
Private Equity: 4%
Owner Origin:
Local: 56%
National: 42%
Foreign: 2%
Miami Multifamily Real Estate Statistics: Leases, Sales, and Projects Under Construction – Q2 2024
Here’s a summary of the statistical highlights, latest multifamily property transactions, vacancy / lease trends, and current market activity for South Florida, with a focus on Miami. The analysis below is derived and compiled from leasing stats, latest transactions, and projects under construction in order to further understand the overall state of the multifamily market in Miami.
Full List of Top Transactions for Q2 2024 Provided Below
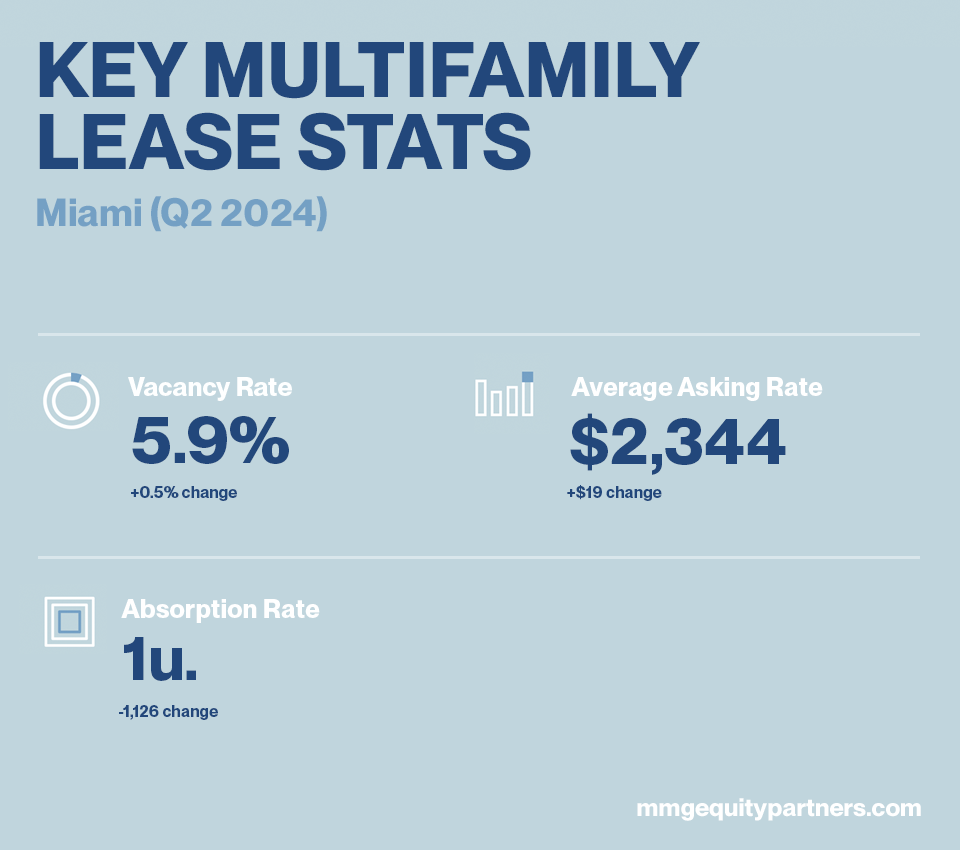
KEY MULTIFAMILY LEASE STATS: Miami (Q2 2024)
- Vacancy: 5.9% (+0.5% compared to Q1 2024 at 5.4%)
- Absorption (Units): 1 (-1,126 compared to Q1 2024 at 1,127)
- Average Asking Rent / Unit: $2,344 (+$19 compared to Q1 2024 at $2,325)
TOP MULTIFAMILY LEASING STATISTICS: Miami (Past 12 Months)
12 Month Deliveries (Units): 7,411
12 Month Net Absorption (Units): 6,568
Vancancy Rate: 5.9%
12 Month Rental Growth: 2.1%
TOP MULTIFAMILY SALES STATISTICS: Miami (Past 12 Months)
Over the course of the past 12 months there have been 231 total multifamily property transactions in Miami with an average vacancy at sale of a little over 5% for the properties. The average price per unit at the time of sale was $276K, and the average sale per property was $5.7M.
Sales Comparables: 231
Average Price / Unit: $276,000
Average Price/ Property: $5.7M
Average Vacancy at Sale: 5.4%
TOP MULTIFAMILY SALES TRANSACTIONS: Miami (Q2 2024)
Top Transaction Highlight in the last 12 months: Casero Apartments for $156M in Q3 2023
1. Casero Apartments (8255 Park Blvd)
Price: $156,000,000
Units: 356
Price/ Unit: $432,202
Year Built: 2022
Vacancy: 7.6%
2. The Pointe at Lakeside (11481 NW 41st St)
Price: $139,250,000
Units: 352
Price/ Unit: $395,596
Year Built: 2013
Vacancy: 4.0%
3. 29 WYN (2828 NW 1st Ave)
Price: $135,000,000
Units: 248
Price/ Unit: $544,345
Year Built: 2023
Vacancy: 59.3%
4. Windsor at Ludlam Trail (7004 SW 40th St)
Price: $91,363,600
Units: 312
Price/ Unit: $292,832
Year Built: 2022
Vacancy: 8.3%
5. Covenant Palms (8400 NW 25th Ave)
Price: $29,300,000
Units: 137
Price/ Unit: $213,868
Year Built: 1968
Vacancy: 0%
MULTIFAMILY PROPERTY CONSTRUCTION PROJECT STATISTICS: Miami (Past 12 Months)
There are currently 79 multifamily assets / properties under construction in the Miami market representing over 24,000 new units into the market. This represents 12.8% of the total multifamily real estate inventory. The average number of units in these 79 properties is 311.
Below the stats you’ll find the top-5 largest multifamily assets currently under development.
Properties Currently Under Construction: 79
Units: 24,593
Percent of Inventory: 12.8%
Average Number of Units: 311
MULTIFAMILY CONSTRUCTION PROJECTS: Miami (Past 12 Months)
1. The River District Apartments – 401 SW 3rd Ave
Units: 1,600
Stories: 54
Completion Date: Q4 2024
Developer/ Owner: The Chetrit Group / The Chetrit Group
2. Namdar Towers
Units: 1,354
Stories: 43
Completion Date: Q1 2028
Developer/ Owner: Namdar Group of Companies / Namdar Group of Companies
3. CentroCity – 3825 NW 7th St
Units: 1,200
Stories: 8
Completion Date: Q3 2024
Developer/ Owner: Terra Group / Not Listed
4. Link at Douglas Apartments – Douglas Rd
Units: 854
Stories: 37
Completion Date: Q4 2024
Developer/ Owner: Not Listed / Adler Properties
5. 3000 – 3050 Biscayne Blvd
Units: 843
Stories: 10
Completion Date: Q1 2026
Developer/ Owner: Crescent Heights
Data sources: MMG Equity Partners & CoStar