Market Snapshot for Orlando Retail Real Estate
We’ve taken a number of the essential statistics for Orlando retail real estate and broken them down below in our report. The retail real estate report is updated every quarter by our in-house commercial real estate experts. First, it is important to give some context to the reasons why Orlando’s retail is doing well currently. It’s no secret that Florida has experienced a population boom during the last few years thanks to a number of economic and lifestyle factors:
1) It is very tax-friendly compared to most states in the USA.
2) Many retired folk from around the country come to live in Florida.
3) It was one of the more business-friendly states during the pandemic.
4) The United States is witnessing a dramatic shift in population from densely populated stats, such as New York and California to states like Florida and Arizona.
5) It is well known for its consistently good weather.
To further expand upon this population growth in the context of Florida, according to the World Population Review, Florida is #7 nationwide for population growth throughout 2021 with a growth of 1.1% overall. Additionally, The Villages, FL (which is one hour NW of Orlando) was found to be the fastest growing metro area nationwide from 2010 to 2020. Of course, population growth is not the only factor that ties into retail real estate, or commercial real estate as a whole, but it is certainly one of the best indicators of where money is going to be spent.
View our commercial properties in Florida to see what real estate assets are available for lease / sale.
Before we get into the specific statistics for Orlando’s retail real estate market in Q4 2024, let’s give a bird’s eye view for the overall capital market figures to give some context to the region’s retail sector.
Orlando Retail Capital Markets Statistics in Q4 2024
Total Asset Value: $44.6B
12-Month Sales Volume: $988.1M
Average Market Cap Rate: 6.5%
12-Month Market Sale Price Change / SF: +4.2%
Orlando Retail Real Estate Sales Volume by Buyer Type & Origin (Past 12 Months)
Below are the buyer types and their origins, i.e.: local, national, or international investors of retail properties in Orlando.
Buyer Type:
Private: 64%
User: 21%
Institutional: 3%
REIT / Public: 12%
Buyer Origin:
Local: 23%
National: 72%
Foreign: 5%
Orlando Retail Real Estate Asset Value by Owner Type & Origin (Past 12 Months)
Below are the owner types and the origins of retail property owners in Orlando broken down by their percentage of representation.
Owner Type:
Private: 49%
User: 27%
REIT / Public: 10%
Institutional: 12%
Private Equity: 2%
Owner Origin:
Local: 30%
National: 67%
Foreign: 3%
Orlando Retail Real Estate Statistics: Leases, Sales, and Projects Under Construction – Q4 2024
A summary of the statistical highlights, latest retail transactions, vacancy / lease trends, and current market activity for Central Florida focusing on Orlando.
Full List of Top Transactions for Q4 2024 Provided Below
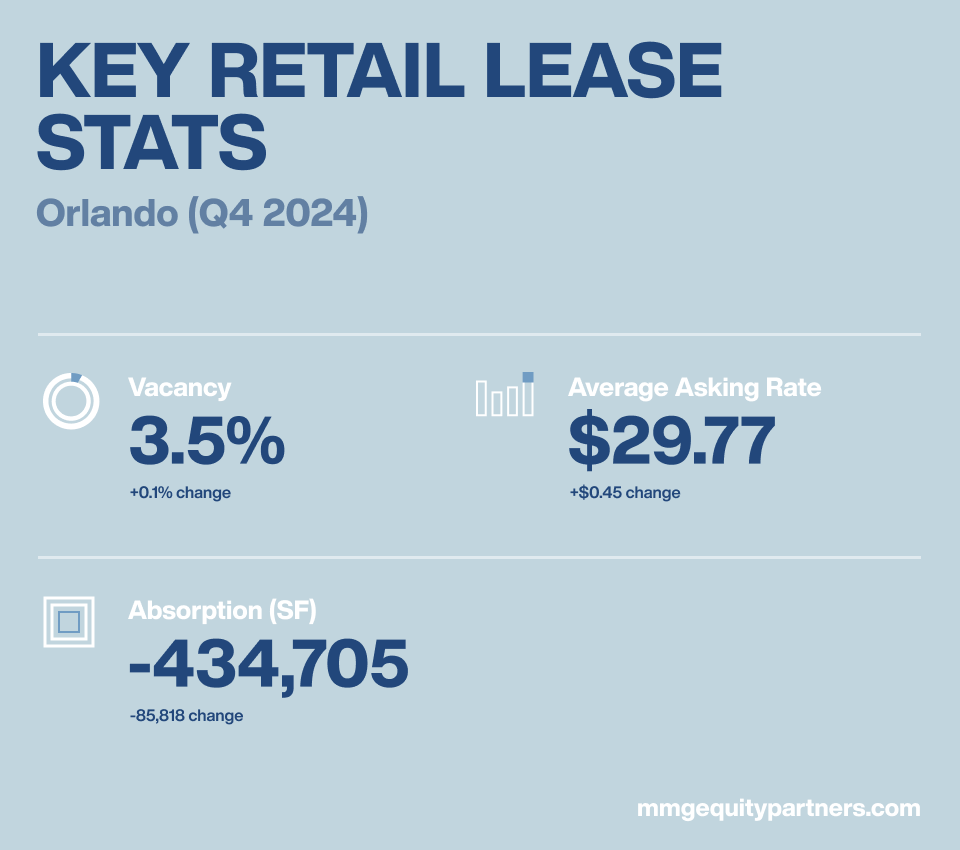
KEY RETAIL LEASE STATS: Orlando (Q4 2024)
- Vacancy: 3.5%
- Absorption: -434,705
- Asking rate PSF: $29.77
TOP RETAIL LEASING STATISTICS: Orlando (Past 12 Months)
12 Month Deliveries in SF: 757K
12 Month Net Absorption in SF: 216K
Vacancy Rate: 3.5%
12 Month Rental Growth: 3.1%
Q4 2024 TOP LEASING TRANSACTIONS: Orlando (Past 12 Months)
1. Lake Nona West – SE Orange Outlying
Tenant: Target
Size: 150,000 SF
Space Type: Shopping Center
Tenant Rep Co:Not Listed
Leasing Rep Co: Lake Nona Land Company
2. Americana Plaza – Orlando Central Park
Tenant: Roses
Size: 52,939 SF
Space Type: Shopping Center
Tenant Rep Co:Not Listed
Leasing Rep Co: Forness Properties
3. Lancaster Square – Orlando Central Park
Tenant: Crazy Hot Buys
Size: 45,300 SF
Space Type: Shopping Center
Tenant Rep Co: Not Listed
Leasing Rep Co: Worldwide Realty Services
4. 7524 Dr Phillips Blvd – Tourist Corridor
Tenant: Crunch Fitness
Size: 37,080 SF
Space Type: Shopping Center
Tenant Rep Co: Crunch
Leasing Rep Co: JLL
5. Plaza on Main – Kissimmee
Tenant: Autozone
Size: 30,810 SF
Space Type: Shopping Center
Tenant Rep Co: Atlantic Retail
Leasing Rep Co: Crossman & Company
TOP RETAIL SALES STATISTICS: Orlando (Past 12 Months)
Over the course of the past 12 months there have been 442 total retail real estate transactions in Orlando with an average cap rate of 6.2%. The average price per square foot at the time of sale was $299, and the average vacancy was 7.0%.
Sales Comparables: 442
Average Cap Rate: 6.2%
Average Price/ SF: $299
Average Vacancy at Sale: 7.0%
TOP RETAIL SALES TRANSACTIONS: Orlando (Q4 2024)
Top Transaction Highlight in Q4 2024: Realty Growth, INC for $68.7 Million
1. MarketPlace at Seminole Town Center (1301 – 2251 Wp Ball Blvd)
Price: $37,892,111
Size: 221,573 SF
Price/ SF: $171
Cap Rate: Not Listed
Vacancy: 1.1%
2. Lake Mary Corners
Price: $22,000,000
Size: 90,293 SF
Price/ SF: $244
Cap Rate: Not Listed
Vacancy: 0%
3. Publix (3839 – 3843 Pleasant Hill Rd)
Price: $19,574,000
Size: 49,824 SF
Price/ SF: $393
Cap Rate: Not Listed
Vacancy: 4.5%
4. Lee Vista Promenade (5800 Lee Vista Blvd)
Price: $16,776,078
Size: 96,908 SF
Price/ SF: $173
Cap Rate: Not Listed
Vacancy: 0%
5. Orange Lake (14928 E Orange Lake Blvd)
Price: $16,650,000
Size: 56,775 SF
Price/ SF: $293
Cap Rate: Not Listed
Vacancy: 1.8%
RETAIL CONSTRUCTION PROJECTS STATISTICS: Orlando (Past 12 Months)
There are currently 53 retail properties under construction in the Orlando market representing a little less than 1.5M square feet of new product. This represents 0.9% of the total retail real estate inventory and over 40% of the total space is pre-leased.
Below the stats you’ll find the top-5 largest retail projects currently under development.
Properties Currently Under Construction: 53
Total Size: 1,493,283
Percent of Inventory: 0.9%
Pre-leased: 80.8%
RETAIL CONSTRUCTION PROJECTS: Orlando (Past 12 Months)
1. Lake Nona West (Lake Nona Blvd)
Size: 405,100 SF
Completion Date: Q4 2026
Developer/ Owner: Not Listed / Lake Nona Land Company
Stories: 1
2. City Center West Orange
Size: 200,000 SF
Completion Date: Q1 2026
Developer/ Owner: City Center West Orange
Stories: 2
3.10700 Clarcona Ocoee Rd
Size:99,590 SF
Completion Date:Q3 2023
Developer/ Owner:Not Listed / Not Listed
Stories: 1
4. The City Center – Retail A (Palm Pkwy & Daryl Carter)
Size: 94,689 SF
Completion Date: Q1 2025
Developer/ Owner: Unicorp National Developments Inc.
Stories: 1
5. Retail (Schofield Rd)
Size: 78,000 SF
Completion Date: Q1 2025
Developer/ Owner: Not Listed
Stories: 3
Data sources: MMG Equity Partners & CoStar
Leave a Reply