The Miami commercial real estate market offers a wide range of interesting projects, assets, and property types due to its advantageous location and pivotal access as an Atlantic coastal town. Its geographic position near Central and South America is a big reason for the overall growth and culture in the area.
These factors give Miami a distinct economic influence and importance as a transportation node between North America, Central America, South America, and Europe. It also possesses a wealth of financial diversity with many opportunities for investors illustrated by a variety of business sectors within the 305.
Along with these elements, there is the presence of wealth from national and international funding flowing into the region as investing in the state continues to produce positive returns. In fact, HFF Securities recently ranked the top US Commercial Real Estate Investment Markets, and Miami stood in 11th place (just below Boston) with an investment score of 3.5.
Additionally, FinancialSamurai.com ranked Miami 16th in the country for commercial real estate investment markets. Tampa-St Petersburg and Orlando also joined Miami on the Top 20 list, showcasing the strength of Florida’s CRE sector overall.
Miami’s commercial real estate also serves as one of the leading contributors to South Florida commercial real estate which shows consistent, positive signs through a wide range of fiscal measurements: economic growth, unemployment rates, vacancy rates, and foreign investments (to name a few). Many of the aforementioned statistics are directly impacted by The Magic City.
It is important to mention that the pandemic has obviously played a role in global and local economies; however, Florida saw an increase of over 450,000 residents from 2019 to 2020, as people are migrating to different states. The Sunshine State offers no income tax for residents, which is a major plus for people considering new places to live.
Insight on the Current Miami Commercial Real Estate Market
Miami and the South Florida market as a whole have remained resilient in the face of COVID-19, benefiting from the strong population migration.
A laissez faire attitude by the FL government towards mandated closures has allowed businesses to thrive during these challenging times; coupled with low taxes and an overall business-friendly environment, many companies are now searching for space to establish a foothold in the area, further accelerating the migration.
For sale inventory has remained dismal; when coupled with strong demand and ample liquidity, this caused downward pressure on cap rates for all product types.”
– Marcos Puente, Director of Acquisitions, MMG Equity Partners
To highlight some of the major economic statistics in the area, we broke down the key points of Miami’s commercial real estate market with metrics that focus on 4 primary sectors: office, industrial, multifamily, and retail. This report includes: cap rates, vacancy rates, sales volumes, and population growth.

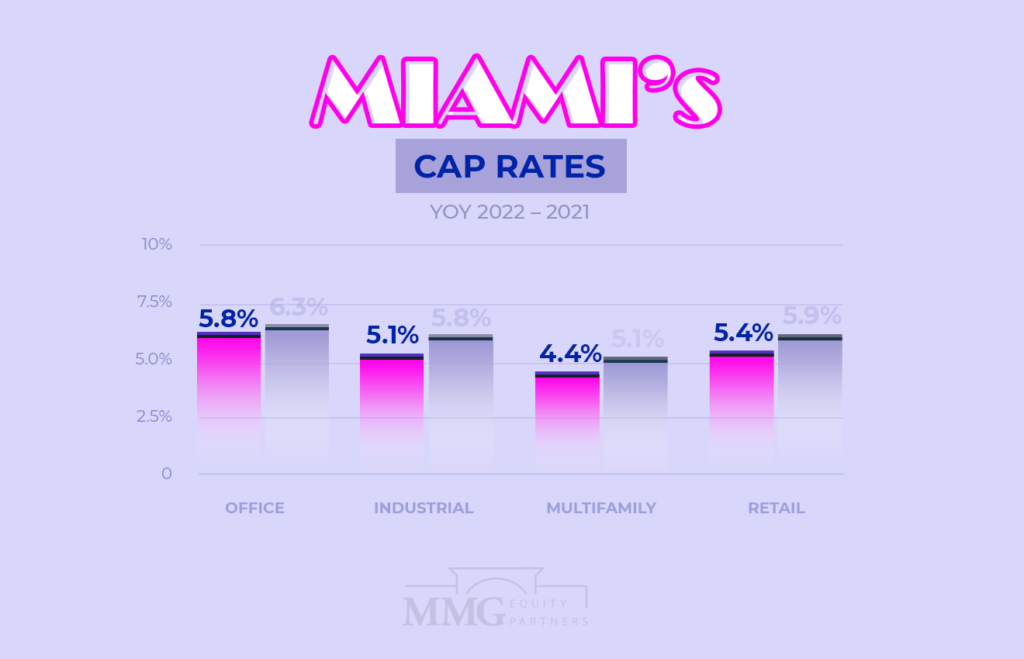
1) Miami Cap Rates
Miami’s cap rates remained fairly stable year-over-year from 2021 to 2022 across all CRE sectors with minimal movement / change. Although it should be noted that they all went down marginally year-over-year.
Office: 5.8% (6.3% in 2021)
Industrial: 5.1% (5.8% in 2021)
Multifamily: 4.4% (5.1% in 2021)
Retail: 5.4% (5.9% in 2021)

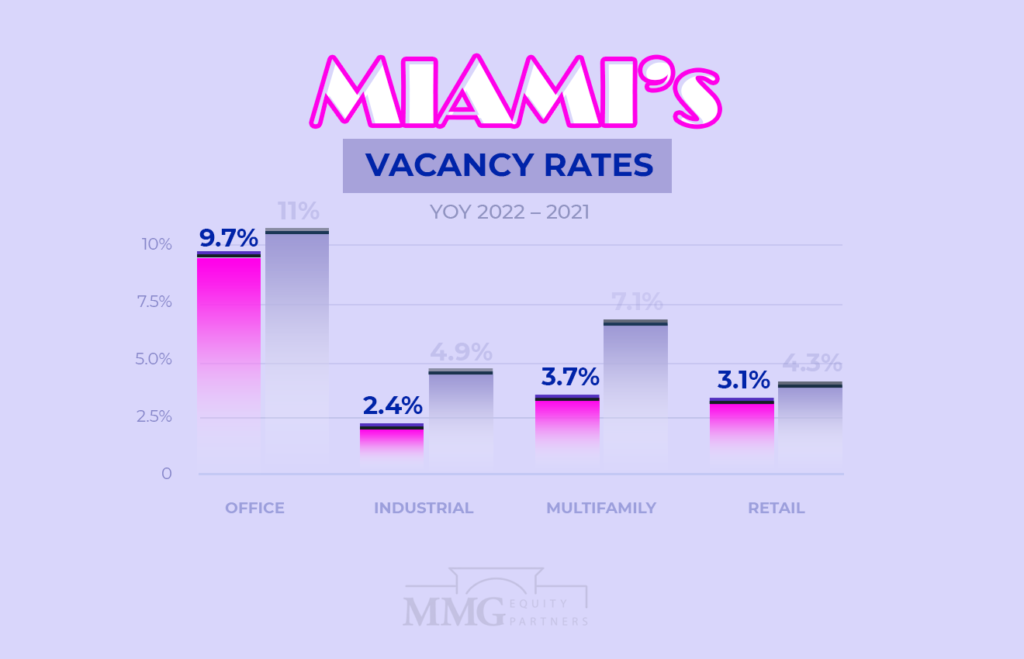
2) Miami Vacancy Rates
Miami’s vacancy rates have also remained stable year-over-year, with the biggest difference seen in the multifamily real estate sector, nearly 50% down since 2021. That’s a big plus for the investment companies and property owners leasing apartments and similar assets around the city.
Office: 9.7% (11% in 2021)
Industrial: 2.4% (4.9% in 2021)
Multifamily: 3.7% (7.1% in 2021)
Retail: 3.1% (4.3% in 2021)
3) Miami Asking Rates
Miami’s CRE asking rates went up across the board, with a massive increase for the industrial real estate sector’s price per square foot.
Office: $43 / SF ($39 / SF in 2021)
Industrial: $17 / SF / NNN ($9.8 /SF / NNN in 2021)
Multifamily: $2,202 / unit ($1,545 / unit in 2021)
Retail: $44 / SF ($37 / SF in 2021)
4) Miami Absorption Rates (12 Month Net)
Office: 1.1M SF (-1.1M SF in 2021)
Industrial: 6.5M SF (4.1M SF in 2021)
Multifamily: 6,192 Units (6,690 Units in 2021)
Retail: 1.3M SF (143,000 SF in 2021)
5) Miami Total Commercial Property Asset Value in 2022
Below are the total asset values of commercial real estate properties in Miami per sector.
Miami Office: $44.9B
Miami Industrial: $63.3B
Miami Multifamily: $67.4B
Miami Retail: $60.6B
6) Miami CRE Sales Statistics (Past 12 Months)
Miami’s commercial real estate market sales in 2022 across the four principal sectors. All sectors saw a big jump in sales compared to the previous year.
Miami CRE Total Sales Volume
Miami Office: $2B ($697M in 2021)
Miami Industrial: $3B ($1.1B in 2021)
Miami Multifamily: $5.7B ($1B in 2021)
Miami Retail: $3.2B ($1.2B in 2021)
Miami Office Sales
Sales Comparables: 549 (327 in 2021)
Average Cap Rate: 6.0% (6.5% in 2021)
Price / SF: $237 ($240 in 2021)
Average Vacancy During Sale: 10.1% (13.4% in 2021)
Miami Industrial Sales
Sales Comparables: 646 (436 in 2021)
Average Cap Rate: 5.1% (6.5% in 2021)
Price / SF: $213 ($135 in 2021)
Average Vacancy During Sale: 7.5% (6.9% in 2021)
Miami Multifamily Sales
Sales Comparables: 468 (190 in 2021)
Average Price / Unit: $344,000 ($222,000 in 2021)
Average Price / Multifamily Property: $13.9M ($6.5M in 2021)
Average Vacancy During Sale: 5.6% (7.2% in 2021)
Miami Retail Sales
Sales Comparables: 704 (354 in 2021)
Average Cap Rate: 5.4% (5.9% in 2021)
Price / SF: $414 ($273 in 2021)
Average Vacancy During Sale: 3.2% (3.2% in 2021)
7) Miami CRE Properties Under Construction
Miami’s commercial real estate market is currently experiencing a strong presence of new construction projects across all sectors. Each sector is adding over 2% minimum of inventory to their respective markets, as indicated by the stats shown below. Miami’s multifamily market is adding over 10% of inventory with apartments and other multifamily assets being constructed meeting the demand of a growing population in the area.
Miami Office Properties Under Construction
# of Properties: 27 (26 in 2021)
Total Square Feet: 3,957,422 (3,471,066 in 2021)
% of Inventory: 3.5% (3.1% in 2021)
Preleased: 77.1% (62.6% in 2021)
Miami Industrial Properties Under Construction
# of Properties: 39 (16 in 2021)
Total Square Feet: 8,009,471 (2,876,539 in 2021)
% of Inventory: 3.3% (1.2% in 2021)
Preleased: 58.5% (46.2% in 2021)
Miami Multifamily Properties Under Construction
# of Properties: 85 (48 in 2021)
Total Units: 23,062 (11,694 in 2021)
% of Inventory: 12.9% (7% in 2021)
Average # of Units / Property: 271 (244 in 2021)
Miami Retail Properties Under Construction
# of Properties: 55 (34 in 2021)
Total Square Feet: 3,674,421 (2,056,662 in 2021)
% of Inventory: 2.6% (1.5% in 2021)
Preleased: 86.9% (77.9% in 2021)
8) Miami Labor Force Statistics
Not unlike a majority of cities across the United States and the entire world, the unemployment rate peaked after the subprime market crash in Miami to 13% in 2009. However, economic recovery during the past few years drastically changed the employment situation for the better. Since 2009 the unemployment rate in Miami dropped nearly 10% to 2.5%.
The labor force has also taken a hit during the pandemic with unemployment numbers rising during the middle of 2020, and then recovering a bit during the latter part of the year. The full statistics of the pandemic’s effect have not been released yet; however, things are heading in the right direction as unemployment rates are continuing to drop around the country.
Labor force statistics are an excellent barometer for the economy, not just because it shows employment levels, but it demonstrates the overall health of the economy. Naturally, when there are more employed citizens, they can then contribute more to the economy by spending and contributing to the fiscal flow.
Household income / year in the Miami region as of 2020 is:
$53,975 for Miami-Dade County
$65,015 for Palm Beach County
$60,922 for Broward County
Fortunately, despite the pandemic the employment situation is moving in a positive direction as more and more people start to call Miami home.

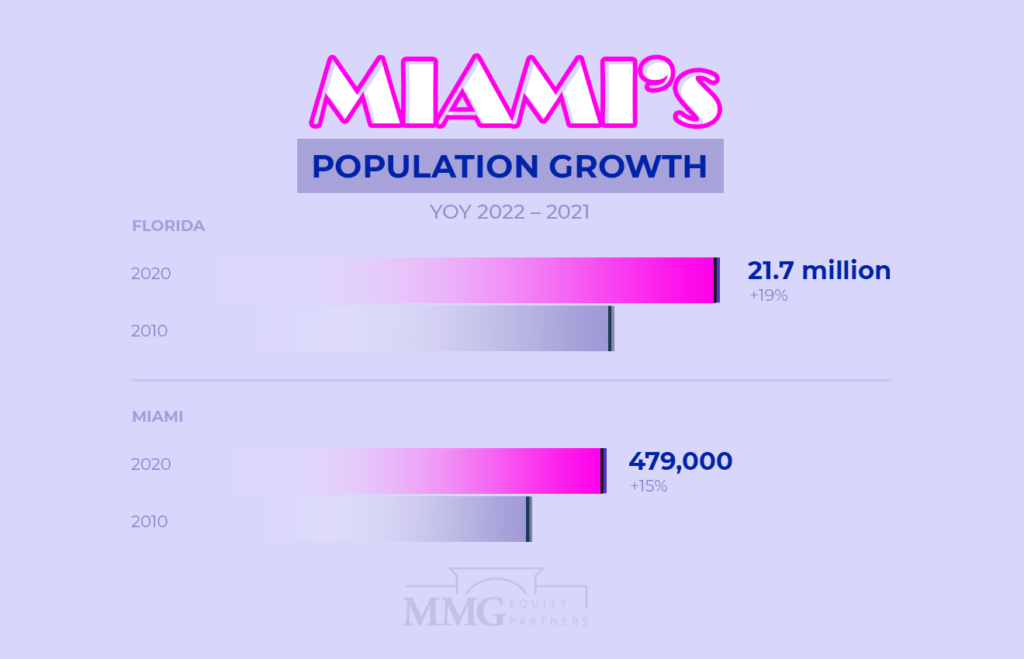
9) Miami Population Growth
One of the most impactful reasons for the previously stated stats is continued population growth. Florida is the 3rd most populated states in the country behind California and Texas.
According to World Population Review, Florida is currently ranked 7th for population growth rate from 2019 to 2020 with a rate of 1.12% growth: from 21,254,926 to 21,733,312 residents (+478,386). To put it into perspective, the population growth is equivalent to that of the residents within the city of Miami. Floridians benefit from beneficial personal tax laws, such as no income tax. The cost of living is also generally lower than most of the East Coast states (New York, Massachusetts, New Jersey, etc).
Furthermore, Florida is projected to hit a population of 23 million residents by 2025.
Meanwhile, Miami is now the 43rd most populous city in the United States with a total of 450,797 residents (representing a population growth of 1.93% from 442,241 in 2020); however the entire urban area is the 4th largest in the nation with 5.5 million residents. Miami also ranked 40th among all cities nationwide in terms of population growth from 2016 to 2018 with an increase of 2.7% (currently 470K+ residents).
Since 2010, Miami’s population grew 15.6%, with a minimum growth of 1.2% and a maximum of 3.25% year-over-year. This consistent, tangible increase of residents in Miami is a primary engine for all of the economic surpluses going on in the area, especially in the CRE market.
This progressive impact is witnessed with the illustrated stats above, and since the population is projected to continue its growth, the commercial real estate market in Miami should continue to produce favorable statistics for investors, developers, and property owners around the urban area.
Figures and stats collected from MMG Equity Partners, CoStar, World Population Review, TheRealDeal and BizJournals reports.
